Category: Blog Post
The analysis and visualization meeting was the last of the methodological meets in the SMR Convergence meeting series. In many ways, it was the most complex. First, analysis and visualization (even visual analytics) are distinct topics. But there is overlap. For example, it is common to use different visualizations during analysis and given the sheer volume of social media data, visual analytic tools can be important during analysis, as well as during other parts of the research lifecycle. Choices about analysis may be informed by visualizations and vice versa – both are key in communicating about a data set and what it means.
Another challenge of this meeting was how to get scholars from different disciplines to a common starting point rapidly in order to have a meaningful discussion about analysis of social media data. One cannot think about analysis without considering the research question, the available sample and how the data were collected, the construction, reliability and validity of social media derived measures, and the computational models used. Therefore, a large goal when planning this meeting was to synthesize vocabulary and bring everyone to that common starting point. We also recognized that each field of research has different analysis techniques and different levels of familiarity with visual analytics. Putting these two topics into the same meeting provided us with the opportunity to think about analysis and visual analytics/visualization in new, synergistic ways.
We refer you to our white paper to understand the core content of the meeting. But we want to highlight a few things we collectively recognized as a group.
First, most of us come from traditions where researchers select a scale of analysis and stick with it – whether it is individuals, groups, or populations. Very few of us work across these scales. Social media is unique because it lets us conduct analyses at all of these scales, allowing for a broadening of our research traditions. Second, social media is not well suited for traditional social science causal research questions. It is better designed for descriptive questions. Casual questions are more connected to information flow, e.g. why some misinformation spreads faster. Third, social media gives us access to a wide range of data, allowing for many different types of analyses. For example, we have access to longitudinal data, network data, and spatial data. We have access to well-structured data values, text data, image data, and/or video data. These different forms of data allow for analyses that range from more traditional rectangular analyses to network analyses to predictive analyses. And visual analysis can be part of any of these, but is not being used consistently across disciplines. This is a real missed opportunity. Finally, researchers cannot figure out everything on their own. Social media is complicated and can be overwhelming. As we embark on research involving social media, we need to share our insights and tools so everyone can learn from them, debate about them, and improve on them.
To help with this process, the white paper we created contains different checklists researchers can use to think about different issues that arise when conducting social media research. The white paper then shows the checklists in action for three case studies. For each case study, we overview possible analyses using social media data, create an analysis plan, and highlight the challenges associated with the analysis.
Writing this final white paper really helped pull together the main highlights across all five meetings. We want to thank everyone that participated in all five meetings. It was both educational and fun. Our project team will continue to develop tools, templates, and infrastructure that helps improve research using social media data.
Categories
Convergence on Model Construction
The fourth meeting of our convergence team centered on challenges and opportunities related to model construction for social media research. This meeting involved researchers from seven institutions and nine fields. As could be expected, then, perspectives were varied. Indeed, some of our differences were quite fundamental. In this blogpost, we briefly discuss some of the most exciting (at least to us) discussion points that fundamentally changed the way we, as the main organizers of this particular meeting, think about modeling.
What is a model? Where does modeling start and end?
If we are to start discussing where scholars disagreed when it comes to modeling, we ought to start from the most fundamental of distinctions: What is model construction? Where does it start and end? Our discussions highlighted the fact that computer scientists think of modeling more broadly. The critical distinction was between the social scientists’ approach that tended to separate ‘measurement’ from ‘modeling,’ and the computer scientists’ more holistic view of modeling as including the mathematical transformations needed to produce the variables used in ‘models.’ The difference may be a product of computer scientists placing a lot of emphasis on the development and optimization of computational models for different descriptive and predictive tasks. Of course social scientists have a strong tradition of thinking of sampling and measurement very carefully. The subtle distinction is that in computer science, these steps are intertwined.
Are there advantages to thinking about modeling using the broader framework that is more common in computer science? We suspect that there is — although a more general claim, and one that does not require entirely rethinking what ‘models’ are to social scientists, is that the construction of models and the calculation of variables are fundamentally intertwined.
Ground truth? Does it even exist?
Ground truth: this is a terminology heavily used in computer science. It is used to refer to information that is known to be true (as opposed to, say, inferred information). A common way to evaluate models is to use “ground truth” data to determine how good a model is in approximating/finding that truth. The self-reflections from the computer scientists in the crowd revealed an inclination to label datasets as ground truth without much inspection/questioning (see our white papers on sampling and measurement for more on that). Why are the two fields so different in their comfort in labeling something as ground truth? Two things come to this computer scientist’s mind. First, computer scientists are used to modeling and building systems for automated tasks. Such systems generally have inputs and outputs with a clear set of features/characteristics and clear/fully accurate measurements. This contrasts highly with how social scientists gather and interpret data on human attitudes. So, the idea that we can build sets of data that can be labeled as ground truth is more commonly accepted in CS. Another reason can be due to one concept of importance for computer science training: abstraction. This is how we can build and study complex systems. Each developer working on a particular layer only needs to think about the inputs/outputs/processes at their layer. A safe assumption is that the proceeding process has produced exactly the right input for the current process. Perhaps this comfort remained in place as computer scientists moved on to using their techniques to study social science problems. However, as the ideas of ground truth move to social science questions, calibration of the quality and reliability of the ground truth must be better understood.
Inductive vs. Deductive thinking
Disciplinary differences in the degree to which inductive vs deductive thinking is valued were readily apparent. Inductive approach starts with observations, aiming to generalize from them and developing theories. This approach is more heavily relied on by computer scientists. Deductive theory starts with a compelling theory and tests it. This approach is more of a norm for social science research.
Interestingly, there was acknowledgment on both sides that their discipline leans perhaps too heavily on one side. What explains this behavior? Part of this is grounded in true scholarly priorities/training. Some, however, are simply due to the conferences/journals we publish in and the style of research they expect. While disciplines can help shape research for the better, our discussions revealed that some of these disciplinary norms serve as artificial limitations that would be better removed.
What is the purpose?
Going into the meeting, our organizing team neatly grouped discussions into descriptive, predictive, explanatory, and prescriptive modeling categories. Or at least we thought we *neatly* organized them. This led to some discussions we expected and some we did not. As expected, we saw a clear divide between social and computer sciences when it comes to the degree to which they use/value models for predictive vs explanatory purposes. This nicely paralleled discussions on inductive vs. deductive thinking. Here too, we observed interest in social scientists to identify cases where modeling with a purpose of prediction can be useful. Computer scientists, on the other hand, pointed out an over-reliance on predictive approaches.
We also discussed the importance of correctly identifying the purpose of modeling. We further discussed how a constructed model that is originally not built for a particular purpose can be used for different purposes. Take a regression model predicting one’s income based on numerous demographic and environmental variables. The researchers building this model or policy makers they are informing can try to interpret this model to *prescribe* a treatment. This can have unintended consequences. While the researchers who built the model might be clearer about the strengths and weaknesses of the model they used, policy makers or other researchers might be less well-informed. It is, therefore, crucial for us to be explicit about the goals of our research as well as potential uses of the built models. This includes potential adverse uses of models, with important implications for ethics and fairness.
Where do we go from here?
These represent some (but not nearly all) of our favorite moments from the model construction convergence meeting. So where do we go from here? More conversations that cross disciplinary boundaries are needed to identify other challenges and find ways to tackle them.
How about next steps for our convergence meetings? Our next and final methodology meeting was on analysis and visualization. Stay tuned for a blog post about that meeting as well.
In the midst of the COVID-19 pandemic we maintained our accelerated efforts to identify key features of social media data collection and analysis that scholars need to consider in their research. Our third methodology meeting was focused on data acquisition, sampling, and data preparation. More than twenty researchers covering ten disciplines (statistics, survey methodology, sociology, psychology, communication, political science, public policy, economics, linguistics, and computer science) met virtually over a day and a half to discuss considerations related to these topics. These discussions culminated in a white paper that was produced in the following months. The meeting discussions and the follow-up paper raised critical considerations and led to reflections and recommendations related to acquiring, sampling, and preparing social media data for social science research. Collectively, these considerations frame the data collection process and help determine what any given study using social media data will be able to conclude.
The first consideration focuses on the manner in which social media data are acquired. The primary modes researchers use to collect social media data are through collaborations with social media platforms, APIs, and scraping. Researchers vary in their technical capabilities and access to different strategies in ways that can challenge replicability and can introduce inequities in who can reach which conclusions. Collaborations with social media platforms are sometimes required for understanding the intricacies behind the sample acquired and can allow for more control over research design. Unfortunately, this is not the most common method and collaborations are not uniformly based on equitable access. The two more commonly used methods, acquiring data through APIs and scraping raise other inequity concerns as they require different technical resources, skill sets, and scaling budgets. Thus teams with different levels of skills, and institutions with limited resources may be forced to use one method rather than another leading to differences in the reliability of the process to acquire continuous data and difficulty of replication. In light of these considerations, the paper highlights the need for shared data sources and data portals that can make social media data more accessible to researchers with different sets of skills and institutions with different available resources.
A second consideration is focused on the type of sample and how it relates to the research questions. An interesting discussion between computer science and social science researchers revolved around which study designs lend themselves to focusing on the particular data acquired and which designs yield inferences based on a deeper understanding of how the sample was generated or how the data collected might relate to a larger population (i.e. beyond the sample itself). The paper establishes principles for understanding which social media study designs align well with the former and what approaches might be used with a population inference goal. Social media studies with population inference objectives could theoretically rely on probability sample designs (where every member of the population has a known non-zero probability of beings selected) or non-probability samples that are adjusted or analyzed in particular ways. In addition to differences in the feasibility of acquiring a probability vs. non-probability sample of social media, this distinction raises another equity concern. If findings from social media research studies are being used to generalize to a larger population or to drive policy decisions, who are the entities that made it into the data sample and do they in fact represent others (not selected) in the population. Are there hidden or silent groups? Probability sampling, in theory, ensures that every member of the population has a known chance of being selected and thus is viewed as a more equitable sample. In the absence of the ability to acquire a probability sample of social media posts or users–and if the research aims at representing a larger population beyond the observed sample–the white paper discusses what we need to know about the acquired sample and its entities, the population it came from, and the methods and the necessary conditions needed to bridge the gap between the sample and the population.
The third set of considerations are related to preparing the sampled social media data before analyzing them. Issues related to data exclusions, cleaning, and aggregation have considerable implications for research conclusions. These implications call for transparent decisions and documentation of these essential steps if we are to have any hope of building a replicable and reproducible science based on social media data.
Finally, the paper dedicates a section to the ethical considerations raised for the use of social media data as it relates to Institutional Review Board (or ethics committee) approvals, informed consent, and data dissemination. In terms of informed consent, the paper describes a general hierarchy of conditions that could contribute to establishing a framework on when informed consent is needed for social media research.
The importance of these considerations and others discussed in the white paper is particularly pronounced given the ever-changing nature of social media data and the evolving tools researchers are using to collect, prepare, and examine them. The white paper thus articulates a formal approach to considering the choices. Without a clear understanding of the set of decisions researchers make, there is reason to worry that researchers may reach incompatible conclusions due to different norms of data collection and preparation. The set of options underlying each of these decisions will continue to evolve. As it does so, we need a shared vocabulary for articulating what methods were chosen. Future conversations should continue the interdisciplinary dialogue begun in these meetings to ensure a collective understanding of the set of procedures that define the scope of social media research.
With the modeling meeting coming up soon, it is a good time to reflect on the main takeaways from the white paper on Measurement that emerged from our meeting in September 2020. That meeting’s focus was on the role of standard social science measurement criteria in evaluating measures from social media data. The paper discusses some of these classic measurement criteria, such as construct validity, reliability and bias, and whether they apply to social media measures. This question is especially tricky when these measures are generated with computer science methods. Computer scientists generally do not use these criteria to evaluate their measures, instead, they use concepts like “correctness,” “accuracy” (which can include concepts of precision and recall), “efficiency” (as defined in computer science) and “reliability” (as defined in computer science).
One of our goals in the white paper is to help social scientists and computer scientists understand the different criteria and vocabulary that they use to evaluate measures. We found one major difference was that social scientists make these evaluations by comparing a measure to a theoretical construct. All of these types of social science measurement evaluations are different ways of comparing the measurements to the theoretical construct. But computer scientists usually don’t conceive of a theoretical construct that is separate from their measures, and so do not evaluate measures on that basis. Most computer science measurement evaluation criteria are based on different ways to conceptualize measurement. We do not believe that one approach to measurement evaluation is better than the other. But we do think that, because some of these methods were developed in computer science and are still used predominantly by computer scientists, they have not been sufficiently evaluated by social science criteria. Many have not been compared according to how well they correspond with the theoretical constructs they are intended to capture, and they should be.
Thus, a second (related) goal of the white paper, in addition to teaching computer scientists and social scientist about each other’s vocabulary and evaluative methods, is assessing major existing measurement methods using traditional social science criteria. In the white paper, we discuss strategies for ensuring reliability such as formalizing procedures and metrics for calculating interrater reliability on codes or labels, and those for establishing validity, including the use and selection of ground truth.
Particularly relevant to our next meeting and planned white paper focusing on modeling is our discussion about the difference in goals between creating measures for constructs and creating features for algorithms. We argue some of what computer scientists call “features” are what social scientists call “measures,” but some are not – they may instead serve to capture the data in a way that helps improve the model of an ML classifier. And in that way, assessing reliability and validity may be hard, or at least the bar for reliability and validity doesn’t need to be as high. Defining more clearly the distinction between feature engineering and measurement (and thus between “features” and “measures”), as social scientists understand it, is a question that was challenging for us in this paper, and one we hope we will continue to discuss in the modeling meeting next week.
Another take-home lesson from the measurement meeting and white paper that is relevant to our upcoming modeling discussions is the need for measurement methods to have some level of human involvement to work well. This was one of the key themes of the conclusion of the measurement white paper. What is the role of “fully automated” methods for analysis of social media data today, if any, and what are the best practices for human involvement in building models, particularly those that produce measures for use in social science? We conclude that, at this point, we would rarely recommend “fully automated” measurement strategies in social media research. Computer methods should usually be semi-automated, in which the researcher still plays an active role in some way reviewing the results and modifying the method when necessary. The main reason is that, the brevity of social media posts and the constantly changing nature of the posts themselves and the language conventions in the posts mean these algorithms are constantly being applied to changing circumstances. Humans monitoring and (when necessary) modification is, we believe, the best way to ensure that automated methods produce valid, reliable, precise and relatively unbiased measures
Finally, writing the white paper on measurement made especially clear to us how much all of these steps in the process that we are examining in this Convergence initiative – design, sampling, measurement, modeling, and visualizing – speak to and depend on each other. We hope that this brief review helps us connect our discussions last Fall and to our final two meetings on modeling (next week!) and on analysis and visualization in March.
We are going through one of the most divisive presidential campaigns in the modern era. Both candidates and their campaigns claim catastrophe if the other were to get elected. And they are focusing on distinct topics to make that claim. For instance, while Joe Biden states that democracy and decency are on the ballot, Trump suggests it is law and order. The question is: are their narratives sticking? In a new collaboration with CNN and SSRS, we are starting to answer these questions. A short overview of our methodology that relies on weekly surveys can be found here. And some of our early reflections have been shared here.
In this blog post, I am going to build on these findings to hopefully add more details that might interest politics aficionados and to highlight text analysis techniques that can be leveraged to look at our data from a slightly different perspective. We will have one main goal in mind in this blogpost: highlighting contrasts. After all, as I mentioned when starting this blog, this is what the campaigns are aiming to do.
How to identify contrasts?
Be it the distinctions between what people say about Biden vs. Trump or between what different demographic groups say about each candidate, drawing distinctions boils down to comparing two corpora.
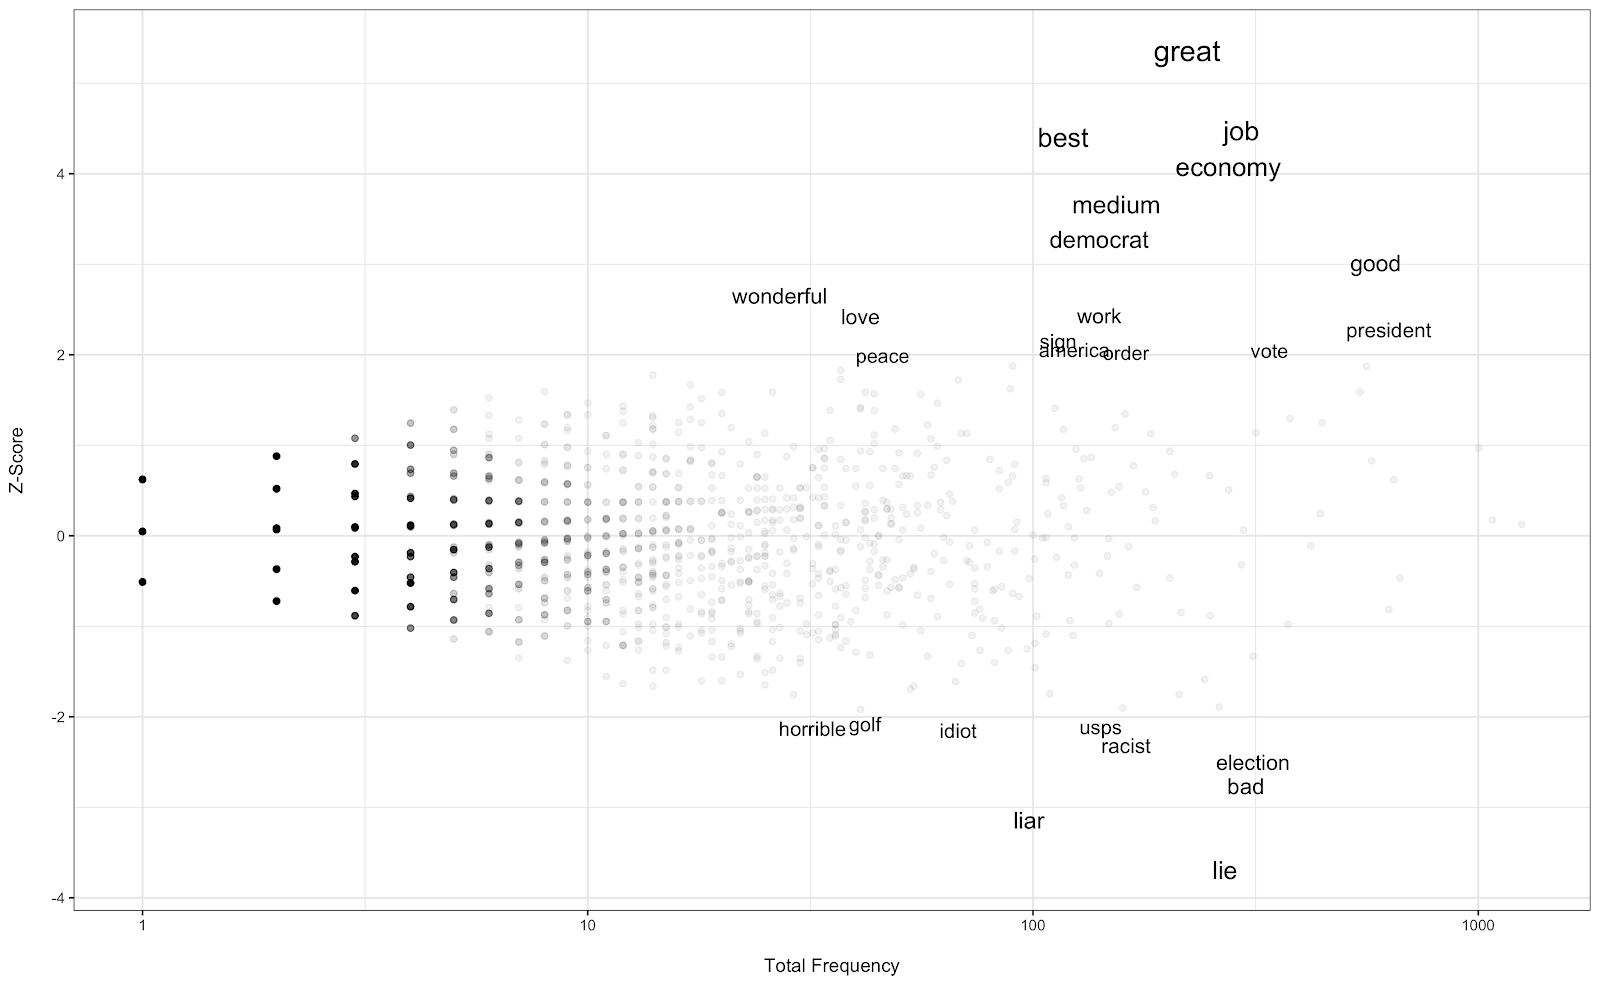
Take, for instance, the distinctions between Trump and Biden. Various natural language processing (NLP) approaches can be used to compare these two corpora to identify their differences. We can start with the simplest approach. One can simply look at the most common words (and indeed some of the analysis already shared on CNN does exactly this). Of course, this does not necessarily provide unique words, just the most popular words. Such an analysis can mask important distinctions by being dominated by generally popular words. Luckily for us, these common words were already rather different for the two candidates, naturally revealing some important differences (see the CNN article linked above). But generally speaking, one needs to build on these simple frequencies to start to understand the differences, for instance by computing the differences in frequencies, the ratio of frequencies or the log odds ratio. Unfortunately, these approaches do not work too well for rare words. Here, we turn to log-odds with informative Dirichlet priors, as introduced by Monroe et al. (2016) as a helpful alternative. This approach uses a third (background) corpus to shrink the estimates based on a prior given by this background corpus, providing better estimates for rare words. The difference in usage of a word w in corpus i (e.g. responses to “read, seen or heard” about Trump) and j (e.g. responses to “read, seen or heard” about Biden) is as follows using this technique:
where fwi is the frequency of word w in corpus i, fwj is the frequency of word w in corpus j, αw is the frequency of word w in the background corpus, ni is the size of corpus i, nj is the size of corpus j, and α0 is the size of the background corpus. We next account for our certainty about those estimates using variance and computing the z-scores for each word w.
What is uniquely defining Trump and Biden?
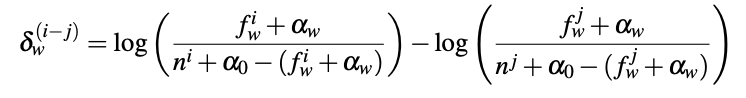
We start examining contrasts with the most basic one: Trump v. Biden. In other words, we ask: “which words more uniquely describe Trump (and Biden)?”. We use the survey responses from July 12 to September 1, 2020. Using this dataset, we construct two corpora: Responses to “read, seen or heard” about Trump and responses to “read, seen or heard” about Biden. Ideally. The background corpus should be a third, and large, corpus that can be used to determine our priors but here we will simply use corpora 1+2 (we will change our background corpus in later iterations of figures, stay tuned!) Having defined our corpora, we are now ready to employ the approach introduced by Monroe et al. and find words that uniquely define the two candidates according to our respondents. Here it goes…
I am using the x-axis to denote overall popularity of the word in our surveys. On the y-axis, I am providing the z-score. Note that words with z-scores in the range of [-1.96, 1.96] are only represented by a dot in this plot, for ease of viewing. Such words are not significantly unique to one corpus. A couple of insights get revealed immediately. First, we observe that coronavirus is top-of-mind for respondents when talking about Trump. VP pick is top-of-mind for Biden. We also see a distinction between the negative topics that stuck for the two candidates. While words like “old” and “dementia” are more uniquely associated with Biden, words like “lie” and “racist” are associated with Trump. One other point to keep in mind: respondents are referring to Biden by name when discussing the candidate while this is not as common for Trump. Indeed, the z-score for “trump” was negative (though not significant). Meaning that that word was more commonly seen in responses given about Biden. This could be because the respondents are more concerned about Trump and are focusing on these concerns when discussing Biden.
How does the party affect what people say about the candidates?
We can use the technique described to next investigate if Democrats and Republicans are remembering similar different words when discussing the candidates. This is exactly what we do.
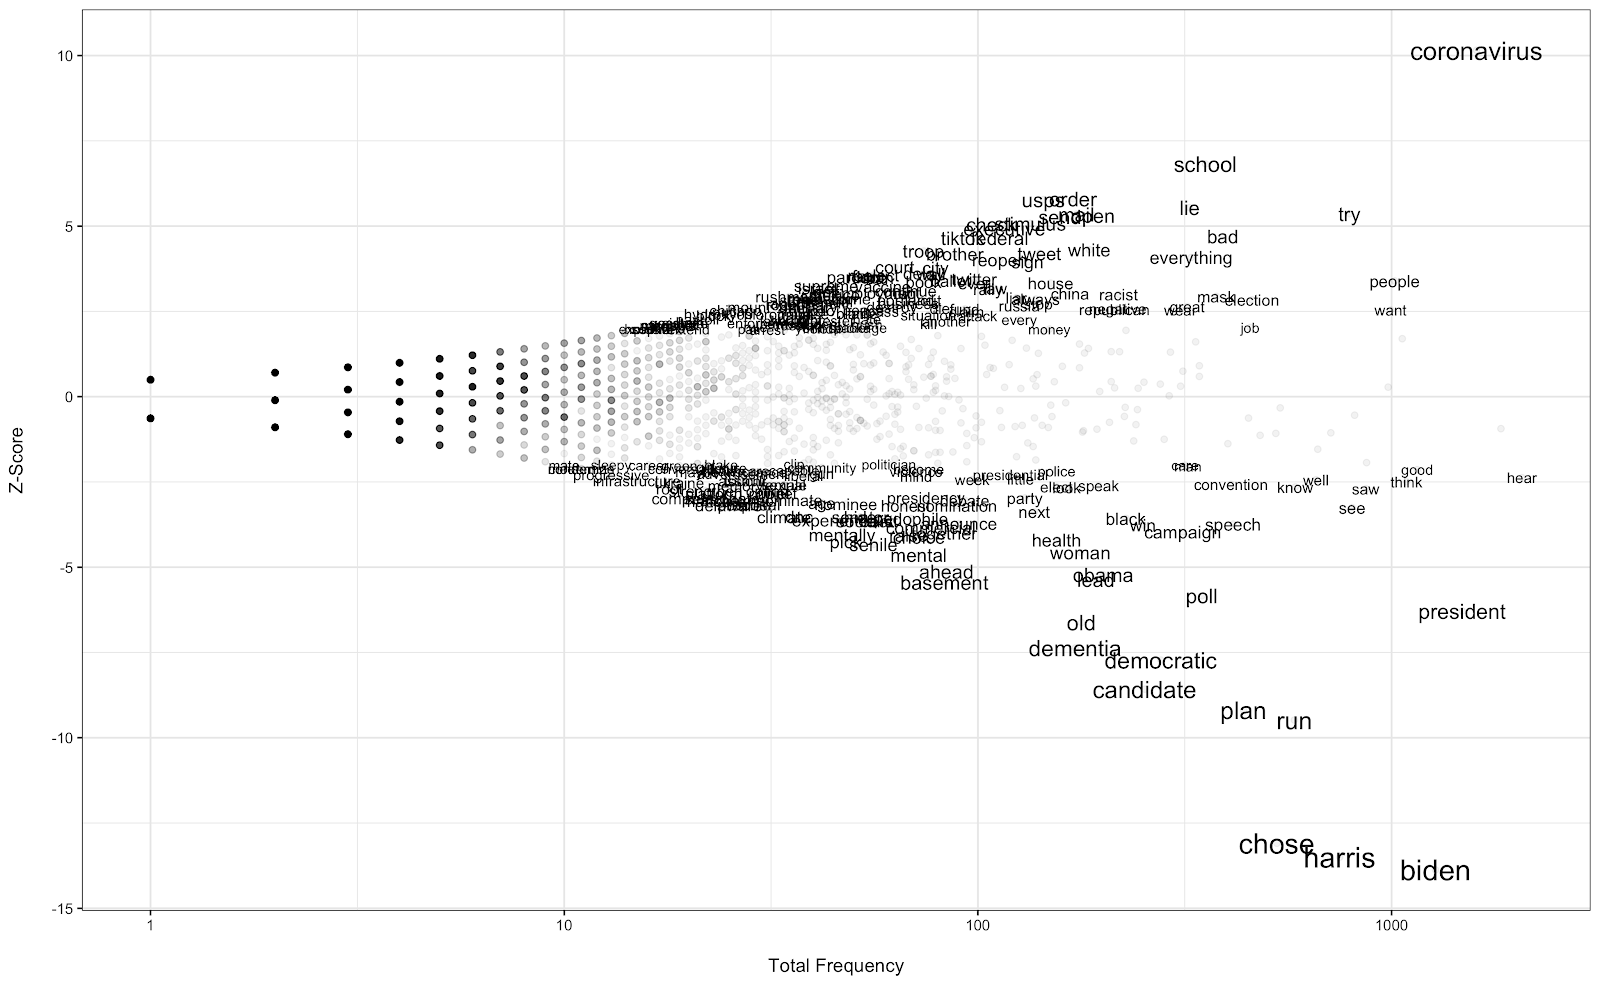
Let’s start with Biden. The two corpora compared are Republican and Democrat responses about Biden. The background corpus includes all responses (i.e. including Independents etc.). The analysis results are below.
Positive z-scores denote words that are more commonly used by Republican respondents (and negative ones are used by the Democrats). Important distinctions are revealed. Some of these are obvious–Republicans use pejorative words and focus on Biden’s age while Democrats are focusing on positive words. Also note the word ‘pedophile’, which might be related to conspiracy theories spreading online. There are also less obvious patterns that emerge. Democrats have a stronger focus on policy words (e.g. economy) and on the pandemic. We also see further support of the anti-Trump focus respondents have when talking about Biden–Trump is more commonly evoked by the Democrats when talking about Biden.
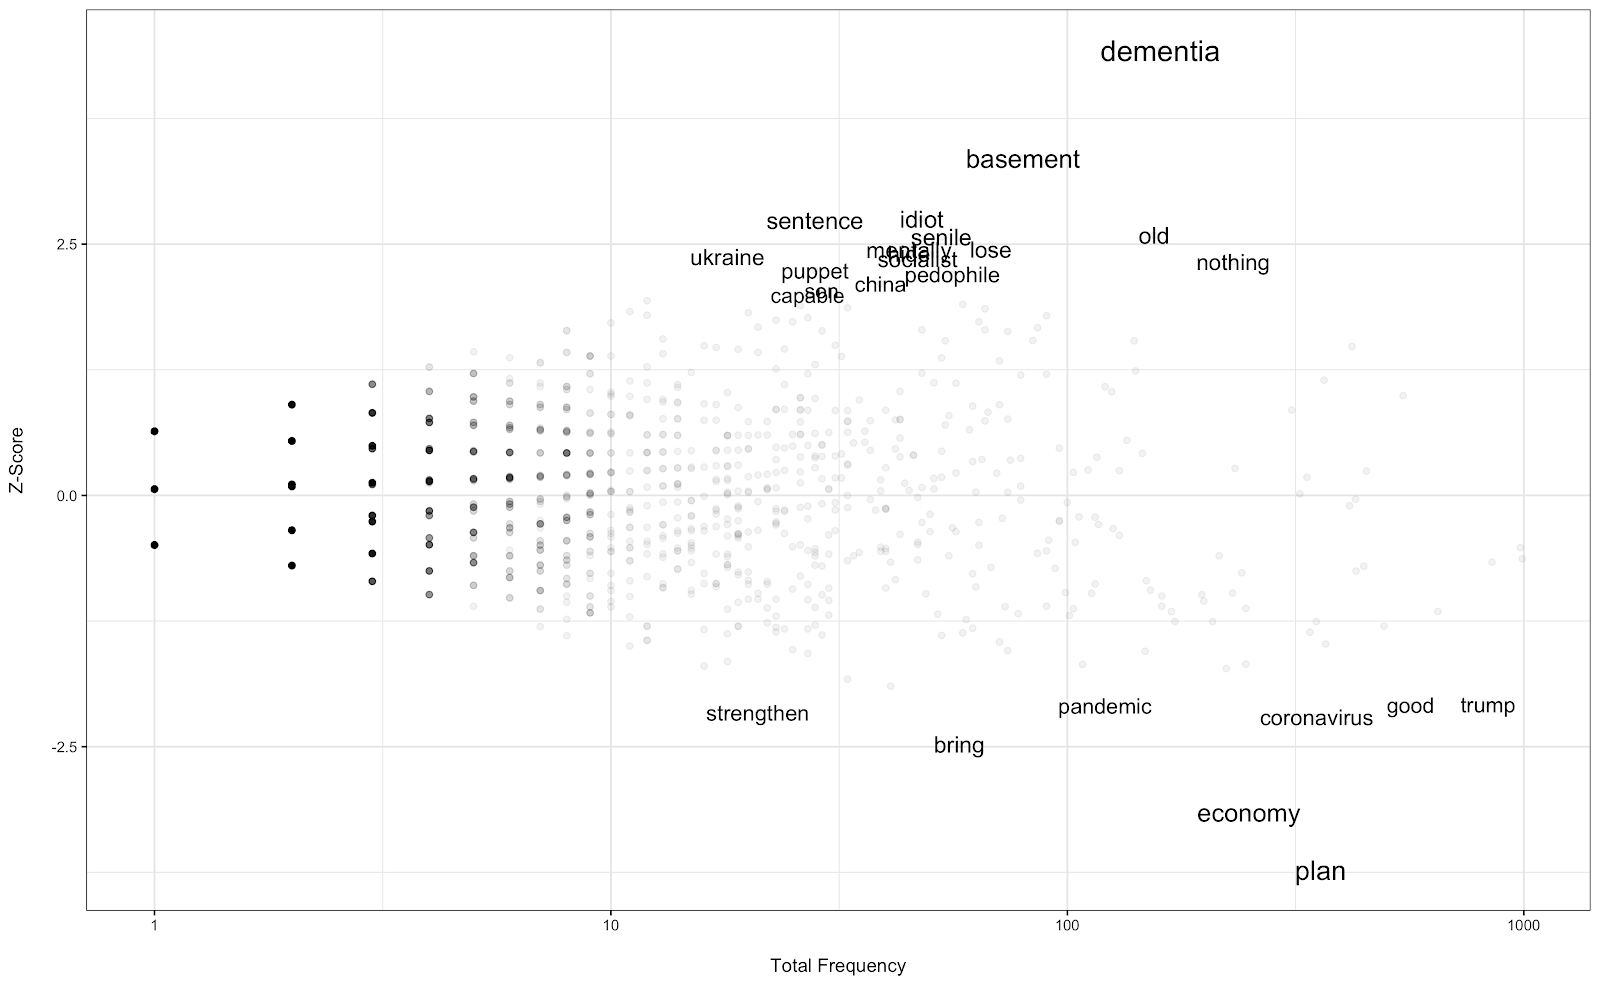
Now, let’s turn to responses about Trump. The plot below shows the result of a similar analysis described for Biden above.
Here, we see a similar pattern. Republicans are using significantly more positive words compared to Democrats. Republicans focus on the media (medium after lemmatization) and the Democrats, more so than the Democrat respondents. They also focus on the economy more when discussing Trump. Interestingly, coronavirus mentions are not significantly different across the two parties. This raises an important point: Assuming that the Republicans are generally supportive of the candidate of their party, this suggests that not all mentions of covid-19 were negative in sentiment. Finally, Democrats also have a unique focus on Trump’s golfing habits and the news about the USPS, highlighting a few scandals that might be sticking (at least so far).
There are various other ways to slice our data and examine contrasts that emerge. But I will limit our analysis to the three comparisons listed above in this blog. There are also various other techniques to apply to examine this rich dataset. And apply we will! For now, I hope you enjoyed this short blog post about our Election 2020 collaboration. Stay tuned for future analysis and updates from us. Check out our website for changes to the plots provided above as we collect more data in the upcoming weeks.
References:
Monroe, B.L., Colaresi, M.P. and Quinn, K.M., 2008. Fightin’words: Lexical feature selection and evaluation for identifying the content of political conflict. Political Analysis, 16(4), pp.372-403.
“It doesn’t matter. You can peer review something that’s a bad study.”
-Dr. Anthony Fauci, a leading member of the White House Coronavirus Task Force, July 31, 2020
Recently a reporter, writing an article on the issues of retracted preprints and this issue of non-peer-reviewed articles, wanted some comments about the use of this mechanism as a way to disseminate research findings. They were surprised at my answer. I shared with them that I think the way to make our research stronger is to get papers out as preprints and not rely on the peer review system that we currently have to be able to determine “poor” science and “good” science. I am going to elaborate on some of my reasoning in this post but also end with some ideas that my colleague, Dr. Lisa Singh, a computer scientist, and I have put together that are borrowed from other disciplines that may help all of our research disseminate more quickly but also with some confidence that what is shared is also rigorous.
As a psychologist, I have been very frustrated with the number of retractions in my discipline that generally fall under the category of questionable research practices (QRP’s). These practices include not making adequate adjustments for the number of models run, excluding data to increase the probability of finding a statistically significant outcome, changing the original hypothesis of a study to match the results of analyses, and many less obvious manipulations of the data or hypotheses. The replication crisis is based on existing published studies in peer-reviewed journals. Even when some of the most egregious studies are retracted, these papers are still in the electronic and printed journal world and still receive citations. Even though many of the QRP’s discussed were considered “normal” research practice for years and thus peer reviewers did not catch them, there is now a large literature that suggests these are poor research practices that are related to poor science. However, these poor research practices persist and papers using them continue to be published suggesting that the current peer-review process is not capable of recognizing and rejecting papers using these practices. Indeed, there are scientists (data sleuths) who have devoted their academic training and careers to identifying papers that should be retracted because they are using poor research practices and making scientific statements that do not hold up to close scrutiny.
In the last 5 years, a surge in preprint services has emerged. These were generally intended as a place to share non-journal formatted “final” drafts of papers that had been accepted to a journal. This allowed for broader dissemination of the science and still met the copyright rules of the journals. These types of “final” drafts had been peer-reviewed and were just awaiting formatting and scheduling in the journal for publication. However, during the COVID19 crisis, in the desire to disseminate research and information quickly, these preprint servers became a place to share “first” drafts of papers that had not yet been through the peer-review process. When some of these papers were noted as being flawed, the community complained that the reasons were due to not going through the rigorous, peer-review process. I argue, however, that these papers went through a more rigorous process once they were made “open” and available for the community of scholars to examine closely and provide arguments and feedback about why they were flawed. This review process happened relatively quickly versus the anonymous and often time-consuming structure of the current peer-review system. Instead of 3-4 peer-reviewers, these papers were often getting 100’s of comments (not all useful) on the integrity of the research. In this way, good peer-reviewing was occurring and doing as it was intended-catching poor science or science done with poor methods prior to publication. It was doing this through an open and transparent process instead of the usual “closed, anonymous” review that has been heralded as the gold standard of research integrity. An open review should be seen as a positive step forward.
We do need to be concerned with incidents that happen where a high profile study is distributed without review but with a press release. In this case, a document that has only been reviewed by the authors is being put out broadly as if it is equivalent to a reviewed and corrected study. This is a practice that needs to be reconsidered because it makes it unclear to the larger community what has been reviewed by research peers and what is in essence-an opinion piece with some data to support it. All research needs to be reviewed by other scientists to make sure it follows the rules of scientific integrity and discourse, and this system needs to be expanded not removed. I think, providing preprints to the community of scholars for review is an important step in increasing our vigilance on getting robust science, but we currently do not have an adequate way to do this and note to the community that a paper is considered solid science by some percentage of the community of scholars that conducts research in the same area. It is a time to look to other disciplines for models of review and dissemination.
Physics was the first discipline to develop an extensive online preprint culture. No other discipline has integrated preprints as effectively. Preprints are an outgrowth of physicists who shared research results by mailing them to colleagues and others in the field. Once it was possible to do this more effectively online, the transition occurred. In comparison to physics, all other disciplines were slower. Even though computer science has engaged in preprints for almost two decades, a decade ago, only 1% of the articles had preprints. In 2017, 23% of the articles had preprints and the percentages continue to grow. The preprint culture is divided in computer science, where some subdisciplines share preliminary results more readily than others. Papers in theoretical computer science or newer areas like deep learning and data science have more established preprint cultures than many other areas of computer science. It is not uncommon to see preprints listed on CVs – similar to working papers in other fields. It is a simple way to show what is in the pipeline. While conferences are the primary forum for community building in many fields, online communities can be just as important. Glimpsing research before official publications can speed up scientific progress and be important for junior faculty who are new to the field. Waiting until the official publication is released can delay the use of or dissemination of research for well over a year. As the pace of research innovation continues to quicken, preprints are necessary to keep up with the latest research.
Using our understanding of the preprint cultures in these two disciplines, their successes, and failures, we present a few suggestions for increasing and potentially, improving the current preprint culture across all fields:
- Instead of viewing preprints as a service for sharing research that will be ultimately published in a journal, we need to view them as an archival service around which research ecosystems emerge. An important goal of every researcher is to advance the understanding within an area of research through different intellectual contributions. Generally, these contributions take the form of a peer-reviewed journal publication, but there are many other forms of intellectual contributions that advance different fields, including white papers, opinion pieces, and data releases. Viewing a preprint service as a place to share any of these types of contributions will encourage others to participate. This was the foundation for the cultural shift in physics and computer science.
- It is important to know the “state” of the work being shared. Is it a first draft that has been submitted? Is it a final draft of a report or other white paper that will not be submitted? Extending preprint services to include categories for types of intellectual contributions and the state of the contribution can help others understand how far along the work is. To date, there is no standard way to categorize the completeness of the work, leading to citations of what may be viewed as preliminary work.
- Preprints are a great way to share null results, particularly in fields that do not have other avenues for them. These null results are important intellectual contributions that lead to important information sharing and possibly more impactful results. Getting them out to the community of scholars through preprints is a good way to adjust for publication bias of only positive results and to help add to the meta-scientific literature on a topic.
- Ecosystems can only be sustained through active participation. Get in the habit of sharing one or two preprints each year and looking at preprint services before publishing a paper. If there is a paper that you have a strong opinion or comment on, share it. Seeing how leaders in a field comment on work, help those new to the field understand how to critique work in their field. My computer science students and colleagues began using preprints before me. Only recently have I realized the richness around some of my research areas. I think if a significant number of senior faculty engage in sharing preprints, the next generation of researchers will already be trained to do so. If leaders of an area use preprints and share them extensively, others within the field will do the same.
Given the current speed of dissemination of information that we have available to us as scientists, finding ways to provide our scientific findings and discoveries relatively swiftly should be a general goal. The important component is to have ways to signal that the science has been properly scrutinized and is rigorous to the values we hold in science. Currently, we continue to do this by elevating peer-reviewed papers in high impact journals as the “gold standard” for science and it is unclear that is the best direction to keep going. By embracing and improving the preprint or pre-peer-reviewed structure we have an opportunity to change the direction of our published science and hopefully improve the quality of scholarly research across all disciplines.
During this time of crisis, we have seen many women emerge as strong leaders. Women have been prominent as leaders of nations and as care-leaders. Almost 80% of healthcare workers are women, and over 80% provide social services (see TimesUpFoundation). Even though they have been warriors during this time of crisis, we need to pause and think about the additional burden we have placed on them and how much we are expecting from them. We need to try to give a helping hand.
I have been outspoken about issues related to women in computer science. In this blog post, I am going to branch out beyond my discipline and call on universities and senior faculty to find creative ways to help our junior faculty who are trying to balance demanding academic careers and young kids that need their attention during COVID-19.
Research and statistics are emerging that show parents of younger children, especially women, falling behind with their research agendas during this COVID-19 crisis (see articles below). As an academic and a mom of two older children (high school and college), I am very worried about this issue. How do we in academia help junior faculty with dependents? How can we help give them options so they do not fall behind or feel guilty about spending time with their young kids when childcare is not available? I am attempting to be gender-neutral since I have a lot of colleagues who are male and spend a lot of time with childcare. However, there is research that shows on average moms spend more time with their kids than dads (see Sani and Tres, 2017 as an example), so we need to understand that this problem may be worse for female faculty. To add to the complexity of the challenge, female faculty only made up 26% of the tenured faculty in 2017 (see Kelly, 2019). How can we improve this ratio if we do not support women, our warrior women, during this crisis?
Here I throw out a few ideas and possible ways to help. I do not think there is a magic bullet for every person, but if there are a pool of strategies, perhaps subsets of them can be used to support junior faculty with dependents (JFD) who are more impacted during these difficult times.
1. Allow JFD to extend their tenure clock without penalty: This one is a no brainer. Letting everyone who does not have tenure delay their tenure clock to ease the pressure they are facing is important. Many universities, including Georgetown, have already done this. Of course, we will not understand whether women or faculty of color will use this more and possibly fall more behind until we are a year or two out. But irrespective, this needs to be an option.
2. To maintain research productivity, allow JFD to delay or reduce teaching obligations: This recommendation is likely one of the more controversial ones, but probably the one that would help the most. Because faculty with young kids need to spend much of their day with their children, teaching during the day can be very challenging. I propose giving junior faculty the option of delaying one course they are teaching until after they receive tenure or possibly even just reducing their teaching load. This means that senior faculty will have to pick up additional courses, but in their case, they would teach a little less after universities are fully open again.
If there is no option for reducing teaching schedules, we should be able to make sure that courses taught by JFD are the smaller ones that require less coordination with TAs and/or less grading.
3. Recalibrate funding expectations: For some fields and research areas, the funding may be increasing. However, for most, it is harder to get right now. Expecting that junior faculty will not get additional funding for the next couple of years needs to be the norm. One way senior faculty can help junior faculty is to find more areas of collaboration so that their chance of getting funding increases. With dwindling resources, senior faculty may have a better chance of obtaining funding than those who are just starting their careers.
4. Proactively limit distractions: Like many faculty I have spoken to, I strongly dislike Zoom. The cost of a meeting is very low, but the toll of having hours and hours of Zoom meetings is very high. Unless a meeting is really important, let’s not have it, or let’s shorten it. For example, do we really need faculty meetings every month? What about a faculty meeting at the beginning of the semester and then again at the end of the semester? Most of the issues that are being discussed can wait or can be resolved by a subcommittee. If a meeting must occur, can we compress it into 30 minutes or an hour? We have to proactively pause and determine whether or not a meeting is really necessary. There are always time constraints, but while faculty are caring for young children, the constraints are harder and more complicated. If meetings cannot be eliminated, the expectation for JFD should be “try to attend”, not “you must attend.”
5. In line with limiting distractions, take these JFD off of committees: Not having committee assignments until there is normal child care available will not destroy a department. Yes, that means senior faculty will need to do a little more. But this is about salvaging the mental health of our JFD. As a senior faculty member, this means that my workload will increase. But I assume if I help my colleagues during their time of need, they will help later when others need their help.
6. Survey all the faculty to understand their concerns and needs: Every university community has its own unique issues. My list is based on issues I have heard through my network of colleagues and friends. However, each university needs to understand its own faculty. Toward that end, set up a (short) survey and get ideas about the largest concerns faculty have and their proposed solutions. It is amazing how many good ideas can emerge by asking those who are most impacted – they have probably been trying to come up with solutions anyways.
7. Proactively provide stress relief and mental health support: Faculty, particularly faculty in STEM, are notoriously bad at asking for help. A university cannot force mental health support for faculty, but setting up help specific to faculty needs and publicizing it to faculty is important. Another option is to assign all JFD a senior mentor from a different department who had a similar family profile (young kids pre-tenure, etc.) to have a one session chat. This allows these junior faculty a connection outside of his/her department. This can be important if there are political issues within a department. Also, no one wants to believe he/she needs help. By having this informal chat, if help really is needed, the mentor can make suggestions, possibly averting a larger issue later in the year.
We can also help faculty organize “coffee chats” where parents struggling with the same issues of work/life balance can build a community amongst themselves. They can share their challenges and discuss how they have dealt with different issues. Some departments have very few JFD and would not be able to find others in similar situations without help from senior faculty or administration.
8. Help identify viable child care options: Faculty may need an hour of child care support when they teach their classes. Having a pool of child care providers that can be called on to help during class times (especially if we are on-campus in the fall) is very important. As an example, Georgetown has child care under normal circumstances, but it may not be available in its traditional form in the fall. Let’s find a way to utilize the existing infrastructure to help faculty for short periods of time through the day. The format may need to be outdoors in a one-on-one setting or for a socially distanced walk, but thinking through this issue will help many faculty.
9. Promote JFD work: Since JFD are less likely to participate in conferences and networking during this time, find ways to feature their work and highlight their research. This may be as simple as creating some articles for the university website. It may also be nice to have some video interviews or new faculty research spotlights. Some departments are very good at this, but this is a place where universities can really make a difference.
We are in a crisis. I am a senior faculty member and I find it challenging to manage my new schedule. Junior faculty with small kids or those caring for elderly parents may be struggling significantly more. I have no doubt that all these JFD and warrior women will figure out how to manage juggling everything during this crisis. However, wouldn’t it be nice if we were proactive and helped them thrive, not just survive. As senior faculty and administrators, let’s find innovative ways to support them. Let’s set an example of caring for others in our community and making small sacrifices for the greater good. Let’s show that universities know how to lead during times of crisis. Let’s give a helping hand.
Women and research productivity:
- “No Room of One’s Own” by Colleen Flaherty https://www.insidehighered.com/news/2020/04/21/early-journal-submission-data-suggest-covid-19-tanking-womens-research-productivity
- “The Pandemic and the Female Academic” by Alessandra Minello https://www.nature.com/articles/d41586-020-01135-9
- “How Colleges Can Better Help Faculty During the Pandemic” by Vicki L. Baker https://www.insidehighered.com/views/2020/03/25/recommendations-how-colleges-can-better-support-their-faculty-during-covid-19
- “As Covid-19 Erases Line Between Work and Home, Professors Learn to Teach Remotely While Watching Their Kids” by Beckie Supiano https://www.chronicle.com/article/As-Covid-19-Erases-Line/248370
The S3MC group held our first workshop about social media methodology in February. We had a fantastic group of experts come from all over the country to join us in thinking about how to converge study design across social science and computer science, especially in light of new data sources like social media data.
We learned a lot, but one major takeaway was how hard it is to talk to one another.
Every discipline has its own language. We spend years – sometimes even decades – being instructed and socialized into a particular way of thinking about the world, with a set of vocabulary to match. This mild brain-washing, which to be fair has many benefits, turns out to be very difficult to counteract.
At our meeting, we created a board that was available throughout the two-day workshop, where people added words whose meaning they weren’t sure about.
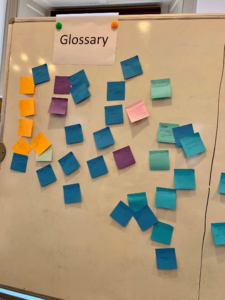
We called this our glossary, although that is probably a bit too generous, since many of the words have yet to be fully defined. Throughout this process, we identified two main issues that can lead to language confusion.
First, there are words, phrases, acronyms, and terms that some disciplines use and others do not. Some examples of this include algorithmic bias, and endogeneity. When someone uses such a term, people from other disciplines are confused because they don’t understand the term. In this case, however, it is relatively easy to solve the problem. The person who doesn’t understand can simply ask for clarification, or point out that they don’t know the term, and the original person using the term can offer a definition.
Second, and perhaps more complicated, are words and phrases that are used across disciplines but in different ways. Examples of this second type of confusion include active learning, reliability, model, sample, and certainty. In this case, confusion may persist longer because people may not even realize they are using terms in different ways. This can cause conflict when everyone thinks they are on the same page (that is, using the same terms), but are actually thinking about things very differently.
So how do we overcome these challenges and use a common language? To some extent, language confusion may be inherent in developing interdisciplinary or multidisciplinary collaborations. But we do think some approaches make it easier to navigate than others.
- First, speakers (or writers, or presenters) can be explicit about what they mean. Rather than relying on disciplinary terms to do some of the explanation, speakers can take a little extra time to make sure a concept or description is clear.
- Second, we think it’s really important to facilitate an environment where saying “I don’t know what that means” or “I’m not sure we’re talking about that idea in the same way” are acceptable statements.
Too often in academia, too much emphasis is placed on being right, and being confident in that right-ness. Fostering an environment where admitting confusion or ignorance is not only acceptable but encouraged as a form of intellectual curiosity, and responded to with respect, can help people to better communicate to one another and overcome these challenges. Interdisciplinary teams need to be open to learning new words and alternative definitions for disciplinary words in order to create a common language for a new team and new ideas. Something as simple as a glossary board can be a great reminder that we don’t always speak the same language, and that is ok!
As a computer scientist, I have always been fascinated by constructing useful insight from large-scale data. When I was a junior faculty member, I wanted to design “clever” algorithms that were efficient. I may have been atypical because I was less connected to the computational task and more connected to the data. I wanted to understand what the data represented, how it was generated, what processing had been done on it, and then develop new ways to describe and use it. Thinking about traditional computational/data mining tasks (association rules, dynamic clustering, anomaly detection) and new ones (stable alliance, prominent actors, bias, and event detection) was a fun mathematical puzzle. I was also very partial to algorithms that used certain data structures (different representations of the data for more efficient processing), particularly graphs (what many other disciplines would call ‘networks’).
Once I learned all I could about the data, I typically moved on. This focus on different types of data may explain how I stumbled into interdisciplinary research. From dolphin observational data to experimental medical data to streaming financial/purchase data, my focus was on developing algorithms that highlighted some aspect of the data that was hidden because of their size or that I needed to keep hidden because of privacy constraints. The algorithms I developed helped other scientists understand their populations better, but even more importantly, the disciplinary theories, ideas, and methods we shared opened up new ways of thinking about old problems in our disciplines.
In the last few years, I have shifted my focus to organic data. Organic data are data that are not designed — survey data are designed by researchers to help research specific hypotheses. Instead they are considered “data in the wild” that are generated in a natural setting. Social media is the largest example of organic data. But instead of just looking at classic and innovative data mining tasks, I have been working with a team of interdisciplinary researchers to help answer social science questions using these data. What is the impact of news and social media on elections? Or more generally, public opinion? How does social media shape parenting attitudes? How can we use organic data in conjunction with traditional data sources to help forecast forced migration? How can we better understand representativeness of different online populations? How does online conversation drive policy and cultural change? These data are a game changer for social science and public health researchers. They provide a new avenue for learning about human behavior, attitudes, and decision making that are hard to capture in surveys or at scale using traditional ethnographic research methods.
As I began working on these different questions using organic data sources, it became clear that every project I was involved with was reinventing a “new” methodology – from study design to analysis and interpretation. I understood a great deal about the data, but very little about the social science disciplines that wanted to use these data – from their methodological traditions to their substantive theories. It became clear to me (and many of my collaborators) that a meta-problem existed. These data contained properties that differ from some of the more traditional forms of data used in social, behavioral, and economic (SBE) disciplines and every discipline was developing its own independent standard for using organic data sets. Actually, it would be more accurate to say that every discipline was applying new customized methods for using social media data to help them advance their research. There are cases when the organic data are similar to disciplinary data. In those cases, the scale of the data made it impossible to use traditional approaches for measuring and modeling the data. Every study being conducted was fairly adhoc, focusing on the disciplinary research question instead of a robust, repeatable research design.
So how could/should we tackle this? A group of 12 faculty in 7 disciplines at Georgetown University and University of Michigan (s3mc.org) recognized the need to bring together researchers from different disciplinary traditions to develop frameworks, standards, and designs for extracting significant research value from social media data and other new forms of publicly available text data. Together, we have all begun learning from each other. We have a clearer understanding of why disciplinary questions require social scientists to understand the data generation process completely to answer their research questions, while computer science disciplinary questions do not. Because of the scale of these data and the mismatch in disciplinary research traditions and outputs, it became clear that computer scientists did not always understand how their algorithms would be used by those in other disciplines and those in other disciplines were sometimes using algorithms without really understanding the underlying assumptions and limitations of the algorithms. It became clear that we had a lot to figure out.
Recently, this group received funding from the National Science Foundation to establish standards for using social media data in SBE disciplines. We are very excited. At a high level our plan is to (1) develop a cross-disciplinary methodology for using social media data in the context of different study designs, (2) create research exemplars (case studies) that use the methodology, (3) build a community of scholars interested in tackling relevant issues, and (4) help develop materials to teach scholars and students how to use these new forms of data in their research.
It is very exciting for me to be part of this large interdisciplinary team looking at how to responsibly use social media data for social, computer, and data science research. I hope that as the project moves forward, we teach each other the important ideas that our individual disciplines can bring to this problem, while learning how to combine them to generate new ideas and thought that transcend any one of them. My long term vision is for researchers to have the ability to blend data from many sources that capture data at different speeds, resolutions, and forms using new computer science approaches and algorithms that incorporate clear notions of validity and reliability, enabling SBE research that addresses disciplinary questions in a more holistic way – explaining and predicting a wide range of social, behavioral and/or economic phenomena. If this vision is going to become a reality, we are going to have to leave our disciplinary comfort zones, toss out our disciplinary hubris and try a few things that we would normally not consider. I hope in five years I write a blog post about how we came together, converged, and made this vision a reality. That we fundamentally changed how quantitative research involving organic data is approached and conducted.
If you are interested in helping create a roadmap and establish best practices for responsible, replicable, and reliable social media research, connect with us. We need everyone to participate. Below are links to different parts of our project.
- The Social Science and Social Media Collaborative – https://s3mc.org
- The NSF Supported Social Media Methodology Project – https://www.smrconverge.org
- The Google group we are using to help create a broader scholarly community interested in these issues – [email protected]
- Hashtag for social media – #SMRconverge