Goals
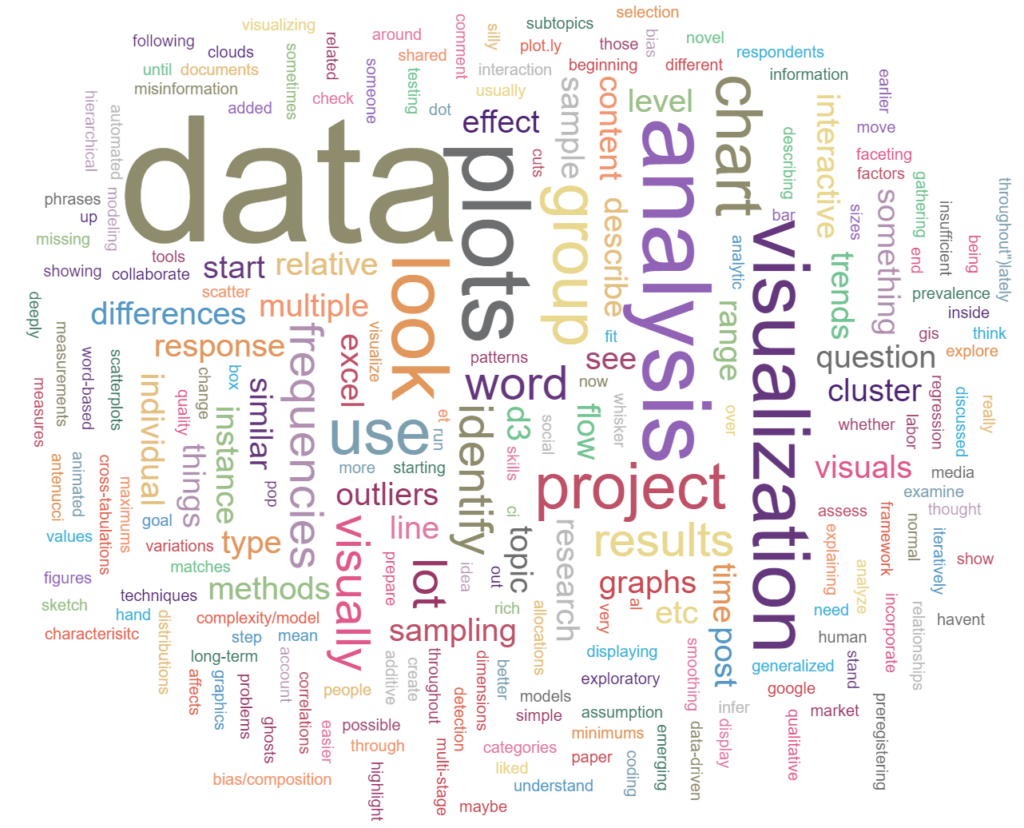
One of the largest differences in traditions across disciplines is the expectation, interpretation, and explanation of analyses and final results. Given all the data points typically involved and the shear complexity of social media data, it is important to think of ways to empower those working with large data sets to gain insight from visual analysis that may be unobservable when looking at the data itself, as well as share results that are more intuitive to those not working with these data by using traditional visualizations, interactive visual analytics and newer forms of visualization. While these are common in computer and data science, they are less common in SBE disciplines. The emerging field of visual analytics uses data mining to reduce the size of the data – filtering the data to include the most interesting parts – and then focuses on identifying cognitively useful representations of the data, encoding meaningful relationships. When analyses have a large data component, visual analytics needs to be part of the life cycle. Some questions we need to address include: Are there large-scale data visualizations that are particularly well suited for social media data sets during the different stages? What visual paradigm will offer the most intuitive interpretations to different types of social scientists and for different types of social media data?
Meeting Summary
The meeting had 24 attendees, including twelve guests from outside the project team who spent a day and a half discussing, presenting, and writing about data analysis and visualization. The team is currently working on a white paper about the challenges associated with analysis and visualization involving social media data and the opportunities for new designs using these data. We are also updating our interactive glossary of terms used differently across different disciplines, and have a Google group discussing social media research.